
5. Data Handling Mathematics Exercise - 5.2 class 8 Maths in english - CBSE Study
NCERT Solutions for Class 8 Mathematics are carefully prepared according to the latest CBSE syllabus and NCERT textbooks to help students understand every concept clearly. These solutions cover all important 5. Data Handling with detailed explanations and step-by-step answers for better exam preparation. Each Exercise 5.2 is explained in simple language so that students can easily grasp the fundamentals and improve their academic performance. The study material is designed to support daily homework, revision practice, and final exam preparation for Class 8 students. With accurate answers, concept clarity, and structured content, these NCERT solutions help learners build confidence and score higher marks in their examinations. Whether you are revising a specific topic or preparing an entire chapter, this resource provides reliable and syllabus-based guidance for complete success in Mathematics.
Class 8 English Medium Mathematics All Chapters:
5. Data Handling
2. Exercise 5.2
Exercise 5.2
- A survey was made to find the type of music that a certain group of young people liked in a city. Adjoining pie chart shows the finding of this survey.
- If 20 people liked classical music, how many young people were surveyed?
- Which type of music is liked by the maximum number of people?
- If a cassette company were to make 1000 CD’s, how many of each type would they make?
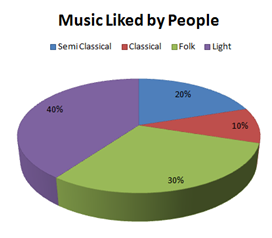
- Number of people who like classical music = 10 %
This 10% present 20 people.
So, 10% represent = = 200 people.
Therefore, 200 young people were surveyed.
- From the pie chart, it can be easily observed that the light music is represented by the maximum part of the pie chart 40%. Hence, most of the people like light music.
- Number of CD’s of classical music = 10% of 1000
= 100
So, the number of CD’s of semi classical music = 20% of 100
= = 200
So, the number of CD’s of folk music = 30%
= = 300
And the number of cassettes of light music = 40% of 1000
= = 400
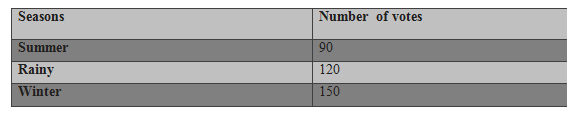
2. A group of 360 people were asked to vote for their favorite’s season from the three seasons rainy, winter and summer.
(i) Which season got the most votes?
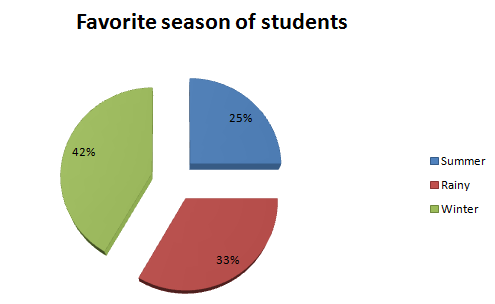
(ii) Find the central angle of each sector.
(iii) Draw a pie chart to show this information.
Answer:
- Winter.
- Total number of votes = 90 + 120+ 150 = 360
Question 3:
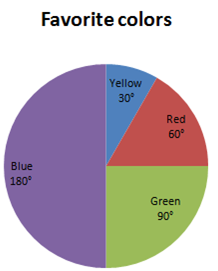
Draw a pie chart showing the following information.
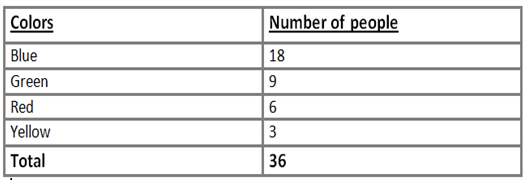
Ans:
The central angle for each color can be calculated as follows.
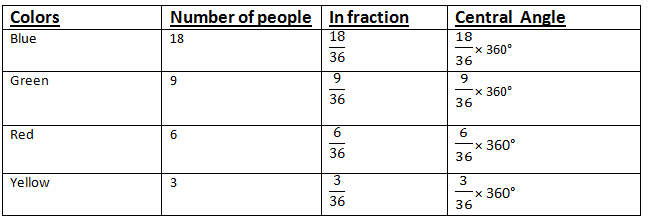
Question:
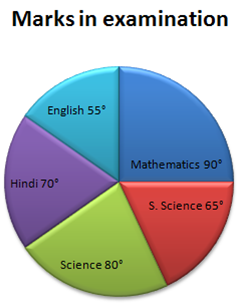
The adjoining pie chart gives the mark scored in a examination by a student in Hindi, English, Mathematics, Social science and science. If the total marks obtained by a student were 540, answer the following question.
In which subject did the students score 105 marks?
How many more marks were obtained by the students in mathematics than Hindi?
Examine whether the sum of the marks obtained in social science and mathematics is more than that in science and Hindi.
(HINT: Just study the angle.)
Answer:
The central angle of each subject can be calculated as follows
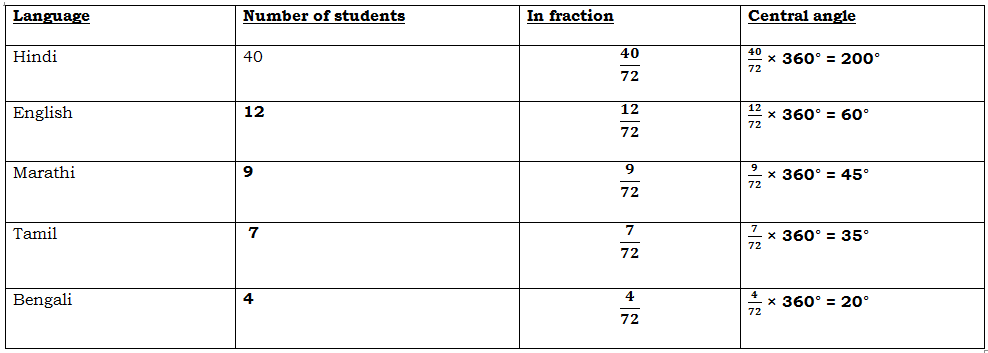
A pie chart of the above data is as follows.