7. रेखीय ग्राफ या कालिक श्रृंखला ग्राफ Class 11 Economics-I [LATEST] Solutions Page-1 in Hindi - CBSE Study
NCERT Solutions for Class 11 Economics-I are carefully prepared according to the latest CBSE syllabus and NCERT textbooks to help students understand every concept clearly. These solutions cover all important 7. रेखीय ग्राफ या कालिक श्रृंखला ग्राफ with detailed explanations and step-by-step answers for better exam preparation. Each Page-1 is explained in simple language so that students can easily grasp the fundamentals and improve their academic performance. The study material is designed to support daily homework, revision practice, and final exam preparation for Class 11 students. With accurate answers, concept clarity, and structured content, these NCERT solutions help learners build confidence and score higher marks in their examinations. Whether you are revising a specific topic or preparing an entire chapter, this resource provides reliable and syllabus-based guidance for complete success in Economics-I.
Class 11 English Medium Economics-I All Chapters:
7. रेखीय ग्राफ या कालिक श्रृंखला ग्राफ
1. Page-1
रेखीय ग्राफ या कालिक श्रृंखला ग्राफ
उदाहरण 1.
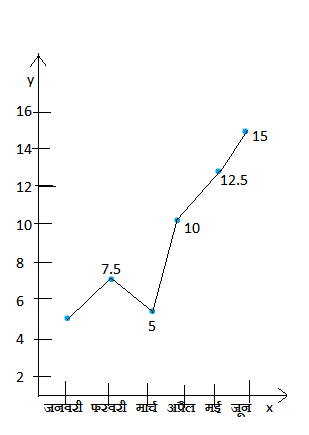
एक फैक्टरी के जनवरी से जून महीने तक के उत्पादन (किंटवल) को निम्नलिखित तालिका द्धारा प्रकट किया गया है | इसे एक बिंदु ग्राफ के रूप में प्रस्तुत करे |
| महीना | जनवरी | फरवरी | मार्च | अप्रैल | मई | जून |
| उत्पादन | 5 | 7.5 | 5 | 10 | 12.5 | 15 |
उदाहरण 2.
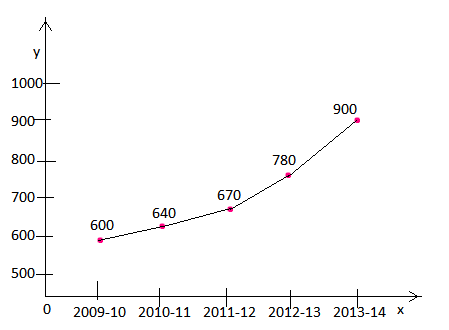
वर्ष 2009-10 से 2013-14 तक के भारत के निर्यात संबंधी काल्पनिक आँकड़े निम्नलिखित तालिका में दिए गए है | इन्हें एक ग्राफ द्धारा प्रस्तुत करें |
| वर्ष | 2009-10 | 2010-11 | 2011-12 | 2012-13 | 2013-14 |
| निर्यात (रुपय करे) | 600 | 640 | 670 | 780 | 900 |
उदाहरण 3.
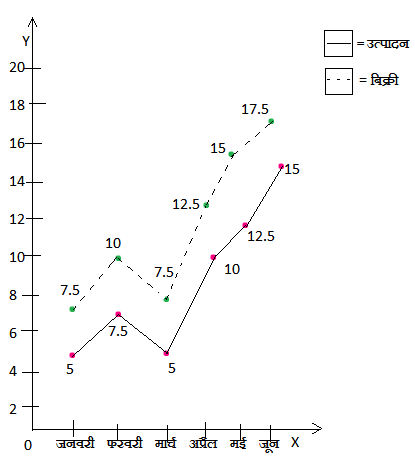
एक फैक्टरी के विभिन्न महीनों में उत्पादन (किंवटल) तथा बिक्री से संबंधीत आँकड़े निम्नलिखित तालिका द्धारा प्रस्तुत किए गए हैं | इन्हें एक चर रेखीय ग्राफ करे |
| महीना | जनवरी | फरवरी | मार्च | अप्रैल | मई | जून |
| उत्पादन | 5 | 7.5 | 5 | 10 | 12.5 | 15 |
| बिक्री | 7.5 | 10 | 7.5 | 12.5 | 15 | 17.5 |
उदाहरण 4.
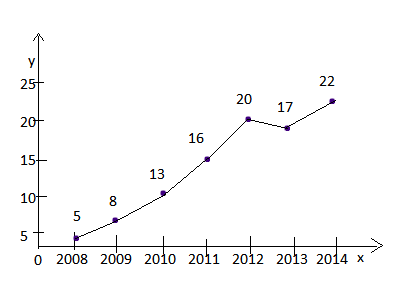
निम्नलिखित आँकड़ो को ग्राफ पर प्रदर्शित कीजिए |
| वर्ष | 2008 | 2009 | 2010 | 2011 | 2012 | 2013 | 2014 |
| गेंहूँ का उत्पादन (मिलियन तन में) | 5 | 8 | 13 | 16 | 20 | 17 | 22 |
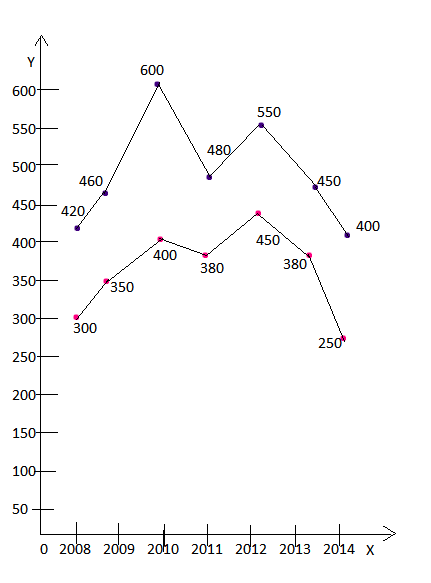
उदाहरण 5.
| वर्ष | 2008 | 2009 | 2010 | 2011 | 2012 | 2013 | 2014 |
| निर्यात (रुपय करो ) | 300 | 350 | 400 | 380 | 450 | 280 | 250 |
| आयात (रुपय करो ) | 420 | 460 | 600 | 480 | 550 | 450 | 400 |
Topic Lists: